Specialist Task Force 273:
Background noise simulation
and methodologies for evaluating the transmission of background noise (CLOSED)
Who we are:
Team Leader :
Hans Wilhelm Gierlich
Team member :
Silvia Völl
What we did :
STF273 has produced:
-
DEG/STQ-00038 : Speech Quality performance in the presence of background
noise, Version 1.
-
REG/STQ-00062 : Revision of DEG/STQ-00011 (EG 201 377-2): Specification
and measurement of speech transmission quality; Part 2: Mouth-to-ear speech
transmission quality including terminals
Read our
Terms
of Reference
Why we did it:
Introduction
Aim of this STF project was to find a
close-to-original recording and reproduction system which fulfills the following
requirements:
- The background noise recording technique
should be
– Easy to use
– Easy to calibrate
– Capable of wideband recording
– Available at reasonable costs
– Mostly compatible with existing standards and procedures used in
telecommunications testing
- The background noise simulation arrangement
should be:
– easy to set up
– usable in typical office type room environments without special
acoustical treatment
– provide a mostly realistic background noise simulation for all typical
background noises occurring in telecommunication applications
– easy to calibrate
– mostly insensitive to the positioning of (test) objects in the simulated
sound field
– applicable to all typical terminals used in telecommunication
– available at reasonable costs
A variety of methods for close-to-original sound recording and reproduction
have been reviewed. The 4.1 loudspeaker arrangement was selected from the
methods reviewed as the most suitable to fulfill the requirements. It provides
background noise simulation in standard office rooms as well as in cars.
Simulation of sound fields in office room
| The setup for simulating a sound field in office rooms is shown in figure 1. The system consists of 4 loudspeakers and one subwoofer which are arranged as shown in figure 1. |
Figure 1
|
| Before a background noise can be simulated via this arrangement, the system has to be calibrated and equalized. Figure 2 shows a block diagram of the calibration and equalization setup. |
Figure 2 (Click on image to enlarge)
|
The equalization is done in several steps:
1. Separate equalization for each of the four loudspeakers
2. Separate level adjustment for each loudspeaker
3. Equalization for the two left-hand and the two right-hand loudspeakers
4. Equalization and level adjustment for the subwoofer
5. Delay compensation
6. Equalization for all loudspeaker (verification and reduction of cross-talk)
Accuracy
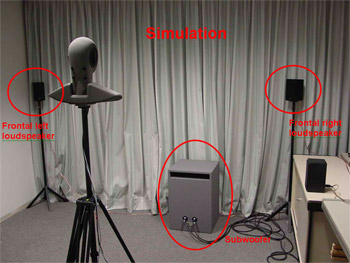
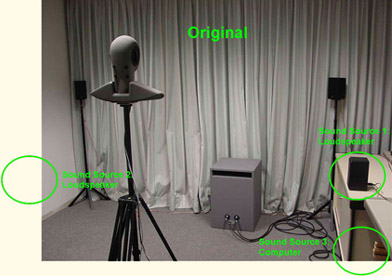
A standard office room was equalized as
described above. To determine the capability of the 4.1 loudspeaker arrangement
the following test was conducted: In addition to the 4.1 loudspeaker setup three
sound sources were placed in the office room: 2 additional loudspeakers and a
computer which produces the typical fan noise. A part of this setup is shown in
figure 3. The sound sources which produce the “original” sound field are marked
green. The speakers belonging to the simulation arrangement are marked red. Note
that the rear speakers of the 4.1 loudspeaker arrangement are not visible on the
photo.
 |
 |
|
Figure 3 (Click on image to enlarge)
|
Via the additional loudspeakers a binaural recording (recorded in a lounge
during the lunch break) was played back. This “original” sound field plus the
computer’s fan noise was binaurally recorded with the artificial head in the
centre of the 4.1 arrangement (see figure 3). In the second step this binaural
recording of the original sound field was played back via the 4.1 simulation
system and again recorded with the artificial head. Figure 4 compares the power
density spectra of the original and the simulated sound field recorded at the
artificial head’s left respectively right ear.
|
|
|
|
Figure 4 (Click on image to enlarge)
|
|
Left ear
(original sound field: green curve, simulated sound field: red curve)
|
Right ear
(original sound field: green curve, simulated sound field: red curve)
|
Two listening examples are available for subjective comparison of the original and the simulated sound field.
Some terminal test Examples
Similar recordings (original and simulated sound
field as described above) are conducted with several types of terminals. As an
example figure 5 and 6 show the power density spectra of the original and the
simulated sound field transmitted via the GSM net with two mobile phones.
|
|
|
|
Figure 5 (Click on image to enlarge):
Mobile phone 1
(with background noise signal processing): original sound field: green curve, simulated sound field: red curve
|
Figure 6 (Click on image to enlarge):
Mobile phone 2
(without background noise signal processing): original sound field: green curve, simulated sound field: red curve
|
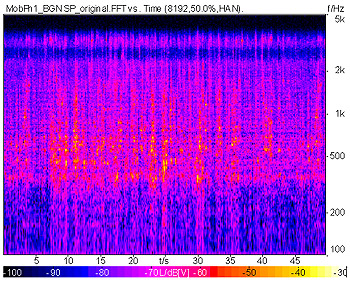
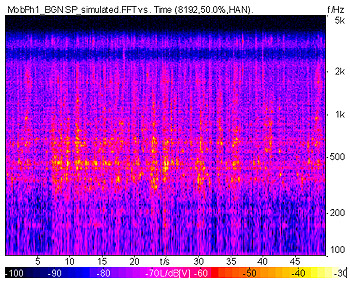
For both phones the spectra of original and simulated sound field match quite well. In addition to the average power density spectra figure 7 and 8 show the 3D power density spectra (versus time and versus frequency) of the original and the simulated sound field for mobile phone 1 (with background noise signal processing).
|
|
|
|
Figure 7 (Click on image to enlarge):
3D power density spectrum of background noise measured with mobile phone 1 (with background noise signal processing): original sound field
|
Figure 8 (Click on image to enlarge):
3D power density spectrum of background noise measured with mobile phone 1 (with background noise signal processing): simulated sound field
|
For subjective comparison, listening examples of original and simulated sound field are available for both mobile phones:
Simulation of sound fields in cars
In principle, the general setup in cars is the same, but differs in the loudspeaker positioning. Figure 9 shows the general setup of the 4.1 loudspeaker arrangement.
Similar to office rooms, the setup has to be equalized before simulating sound fields. Instead of an artificial head the microphone of the terminal under test or a pair of cardioid microphones should be used for recording and equalizaion. |
Figure 9 (Click on image to enlarge):
|
| Figure 10 shows a block diagram of the equalization setup with a terminal microphone.
Irrespective of the selected microphone, the microphone shall be located as close as possible to the position where it is expected to be for customer use, usually in the rear-view mirror or at the ceiling.
The equalization of a car is much more sensitive than the one of an office room due to the fact of smaller cabin dimensions and hard-surface surroundings (e.g. panes).
It is therefore highly
recommended to use the microphones of the terminal under test and position it at its final position.
|
Figure 10 (Click on image to enlarge):
|
Accuracy
After a demo car was equalized with a pair of cardioid microphones some validation tests were conducted. During a constant driving situation car recordings were made in the demo car with the pair of cardioid microphones, two mobile hands-free telephones and a microphone array. These recordings were used as the reference for the further investigations. For the simulation the recordings of the cardioid microphones were played back via the 4.1 simulation system and again recorded with all terminals. Figure 11 shows the power density spectra of the original and the simulated sound field recorded with the cardioid microphones.
|
|
|
|
Figure 11 (Click on image to enlarge)
|
|
Left cardioid microphone
(original sound field: green curve, simulated sound field: red curve)
|
Right cardioid microphone
(original sound field: green curve, simulated sound field: red curve)
|
Terminal test
As an example, figure 12 shows the power density spectra at the output of a microphone array for the original and the simulated sound field.
For all terminals the spectra of the original and the simulated sound field match quite well. |
|
|
Figure 12 (Click on image to enlarge):
Power density spectra measured for a microphone array with integrated noise cancellation, positioned at the ceiling near the rear-view mirror: original sound field (green curve), simulated sound field (red curve)
|
For subjective comparison listening examples of the original and the simulated sound field recorded with the cardioid microphones and the microphone array are provided.
* Note, that for a correct playback of the binaural listening example equalized headphones are needed. However, for a quick comparison also non-equalized high quality headphones can be used.
How to contact us:
If you would like more information, please contact the STF Leader: h.w.gierlich@head-acoustics.de
Note: this information is based upon STF working assumptions. The views expressed do not necessarily represent the position of ETSI in this context.